 |
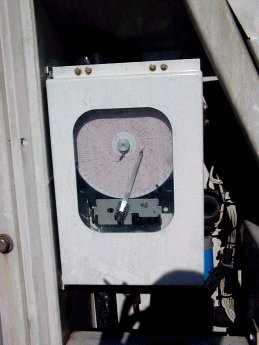
Figure 37: Circular temperature chart recorder |
Generally the return air temperatures are recorded since these can be used to draw conclusions about the temperature of the cargo. However, there are some exceptions. Some refrigeration unit models record the supply air temperature and some record the maximum value of the supply air and the return air. Recorders that record both the supply and the return air temperatures are rare. With recorders of this type it must be remembered that there is a time lag between the two recorded temperatures which generally makes it difficult to pinpoint times accurately.
The recorders are either fitted with a spring wound mechanism that must be wound when the chart is put into place, or they are electrically-driven. During times when the container is without a power supply, the recorder is powered by a battery.
The recording is made on pressure-sensitive circular charts similar to carbonless paper. The stylus of the recorder puts pressure on the chart and thus draws a line. These charts should never be used as a support when writing, since this pressure would also leave a mark. Its is also recommended that charts should be protected by card when they are sent by post to avoid accidental pressure being applied.
These charts usually record 31 days of data (a single revolution), but there are recorders and charts designed to record a week's worth of data.
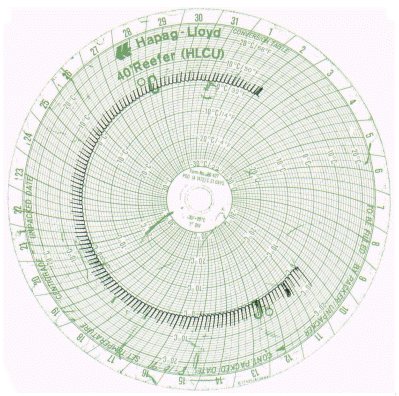 |
| Figure 38: A circular temperature chart from a refrigerated container |
Figure 38 shows a typical temperature record on a chart of this type. The regular temperature peaks show the defrosting operations which, in this case, took place every four hours. These defrosting peaks can be very different in character and are influenced by the stowage method in the container, the length of the defrosting period, the nominal temperature as well as the position of the sensor. They are caused by the fact that during defrosting, warmed air rises from the air cooler and comes into contact with the return air temperature sensor.