Unfortunately the method used to stow the goods in the container often does not allow this to happen. Typical stowage errors can be seen in figure 46. These include in particular the circulation bypasses as shown in the three examples at the top, or interruptions of flow as caused by the cargo being stowed too densely, exceeding the maximum stowage height and the use of covers, among other things, as shown in the bottom examples.
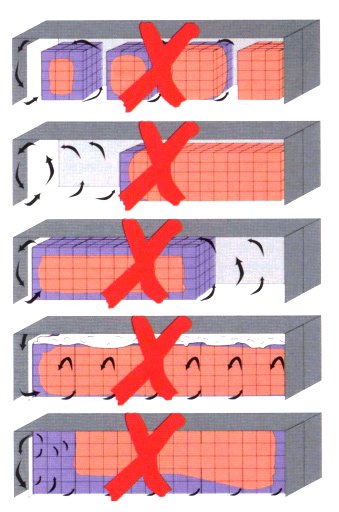 |
Figure 46: Stowage methods in refrigerated containers that may lead to poor temperature distribution within the cargo and should thus be avoided |
Other faults are also possible in addition to the ones shown in Figure 46. An evenly distributed, but loosely packed cargo with a number of small circulation bypasses can also mean that no cold air circulates at the rear of the container (at the door).
The information that the return air temperature offers with respect to the temperature of the cargo will thus depend largely on the way in which the cargo has been stowed in the container. If there are serious circulation bypasses, the return air temperature will be very close to the supply air temperature. If the airflow through the cargo is good, the return air temperature will be very close to the temperature of the cargo.
Since the air that flows through the cargo space must always remove the heat coming from outside the container as well as any heat caused by ripening or cooling processes, the return air temperature should usually be higher than the supply air temperature where the cargo temperature is being maintained. As a general rule of thumb, approximately 500 W of heat enters a 40' container for each 10°C difference in temperature compared with the ambient temperature. When operating in low-temperature mode with a 40-fold circulation of air, this leads to a temperature increase of approximately 0.6°C over the supply air temperature, when operating in chilled mode with an 80-fold circulation of air, the increase is approximately 0.3°C. With greater differences in temperature compared to the ambient temperature, this value increases accordingly, and a temperature increase of approximately 3°C can thus be expected for a 50°C temperature difference (inside -20°C, outside +30°C). Since the circulating air exchanges heat with the cargo this is also the range in which the cargo temperature may normally vary according to the location of the cargo within the container.
However, if there are areas within the container in which no air or very little air is able to circulate, these areas may experience considerable increases in temperature. An example of such a case is shown in Figure 47.
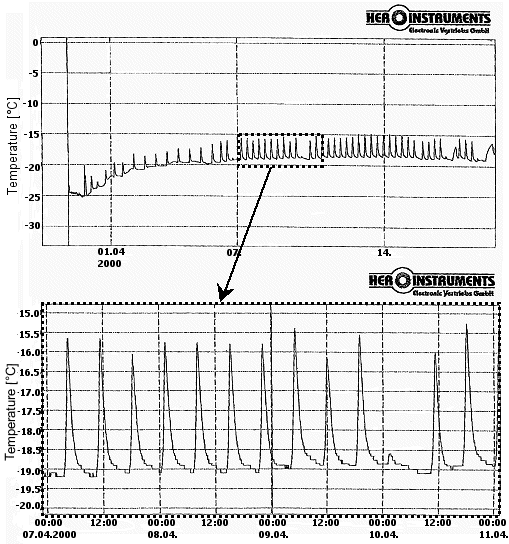 |
| Figure 47: Example of temperature increase at the door as a result of incorrect stowage and the lower level of air circulation caused by this (for the entire duration of the journey and an enlarged extract) |
The goods were loaded into the container at a temperature of -25°C. This is also the nominal temperature value. The supply air temperature was at -26°C during the entire transport, the return air temperature was at -24°C. This data was recorded by the data logger of the container. An electronic data logger was placed on the last pallet in the container. The data from this data logger is shown in figure 47. At the start of the journey the temperature was as required at -25°C. It rose to -19°C over a period of approximately six days. This temperature was then maintained. This behavior suggests that in the area where the data logger was placed, the circulating volume of air was not sufficient to completely remove the heat coming from outside and maintain the temperature at -25°C. Only at -19°C was an equilibrium achieved. The enlarged section of the temperature chart makes this very clear. Since the data logger was located on top of the cargo, the defrosting processes were registered very quickly since a layer of warm air formed at the top of the container.
Once the refrigeration process was started again the temperature sank slowly back to the equilibrium temperature of -19°C. If the flow of air had been sufficient around the data logger, the temperature at the end of the defrosting cycle would have sunk just as fast as it rose. Since this was not the case, we can conclude that this area of the container was subject to very little air circulation. However, the temperature recordings do not reveal whether the low air flow was caused by interruption of the flow by stowing the cargo too densely at the door or by a circulation bypass in the front part of the container. The only way of determining this is from surveyor reports which show the way in which the cargo was stowed in the container.